Kinetica Blog
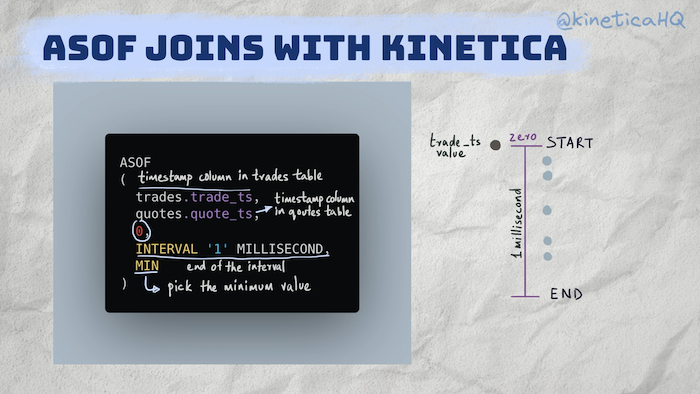
ASOF joins with Kinetica
Combining two or more tables using values from a related column is one of the most common tasks when analyzing data....
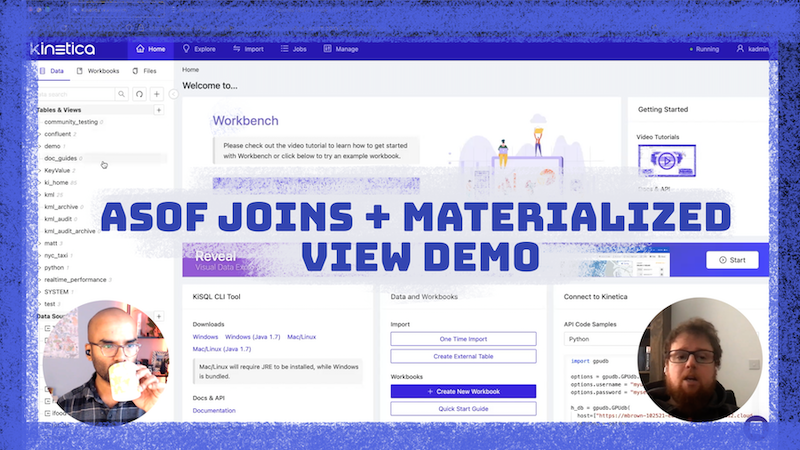
Demo: a real time IoT monitoring system for cold transit trucks
Interrupted or incorrect temperature control during transit is the cause of over one-third of the world’s food spoilage....
Using PostgreSQL applications with Kinetica’s native wireline support
Kinetica, the database for time and space, has added support for PostgreSQL wireline in its 7.1.6 edition....
Risk Analysis – How to Prevent a Billion Dollar Meltdown
Most investors monitor risk on an infrequent, daily, weekly or even worse, monthly basis....
The Internet of Things in Motion (IoTiM)
Sensors have evolved from taking readings over time to taking readings over space and time....
Get Started with the JDBC Connector
This tutorial will walk you through how to get started accessing Kinetica with the JDBC Connector....
Tutorial – Interactive 3D Visualizations of Massive Datasets
Introduction
For companies engaged in oil and gas exploration, getting fast access to high resolution data is an important enabler for finding the right locations to drill a well before their competitors....
From Batch to Streaming Analytics – At Scale?
The problem is widely felt. As data collection has mushroomed, traditional data systems struggle to produce timely alerts to problems and other real time events....
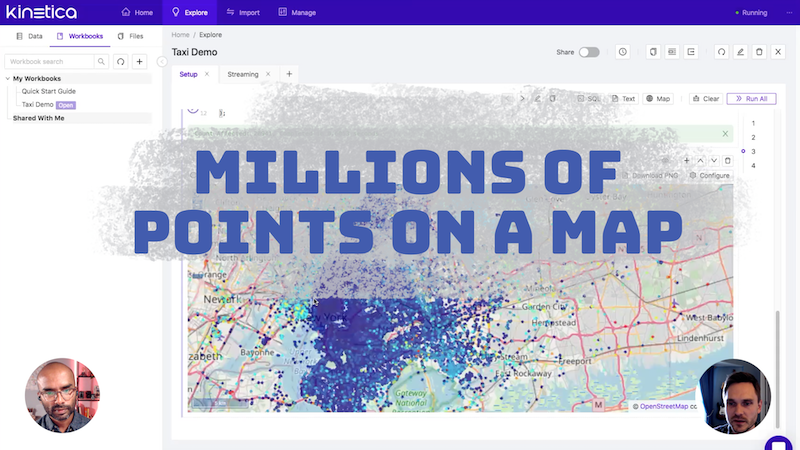
Analyze and Interact with Millions of Points of Geospatial Data on the Fly
Spatial data analysis is computationally intensive. Most solutions grind to a crawl at a few million points....
Spatial Analytics: Optimizing Graphs on Geospatial Features
Our sat nav gives us options of the shortest route home, or avoiding tolls or highways. But what if we want the most scenic route home, or the most well-lit? Learn how to do this using a road networks as graphs, geo-spatial features as graph networks and graph optimizations.