Kinetica Blog

Getting Started with Geospatial Functions
Geospatial data is any data that has a geographic component to it. A geographic component simply implies a location (or a set of locations) that can take the form of simple points on a map with latitude and longitude coordinates or more complex shapes that describe lines and boundaries, or even elevation....
How to Optimize Supply Chains for COVID Vaccine Distribution using Geospatial Graphs
Multiple Supply Demand Chain Optimization (MSDO), is a common logistical problem where there are multiple sources and sinks and you're looking for the most optimal delivery routes.
Data Visualization Forms in Kinetica
In this tech note, we’ll examine various data visualizations in Kinetica. In general, a typical data set might have both spatial and temporal components, called spatio-temporal. The nature of the spatial data variation is usually continuous.
Accelerating Geospatial Queries for Supply Chain… from Days with Alteryx, to Seconds on Kinetica
Recently, a top 3 global retailer was able to reduce run times for a strategic analytic application from days on Alteryx to just 22 seconds using Kinetica....
An Introduction to OLAP for Data Analytics
Data is a critical part of modern businesses. Almost all of our interactions with businesses – online or otherwise- end up touching a business decision system that is based on data....
Streaming Data Use Cases: Supporting Real Time Store Replenishment Needs
For major retail companies, it is a crucial challenge for the business control center to know each store’s in-stock quantities in real time....
Do you need a database for real-time streaming data?
What is Real-Time Data Streaming?
Businesses used to expect their data to arrive in batches, made available for analysis after the fact....
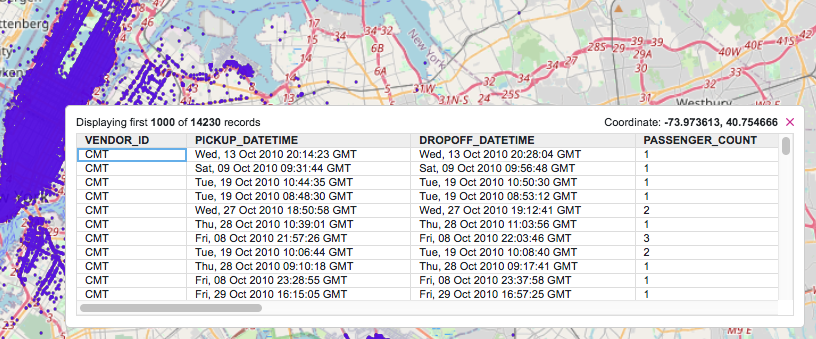
Getting Started with Spatial Data
With the vast volume of cellphones, packages, vehicles, purchases and other items moving through time and space, a good foundational understanding of how spatial data can be used is increasingly valuable....
How Data Analytics Can Help Combat Climate Change
Today marks the 51st anniversary of Earth Day! Inspired by the 1969 Santa Barbara oil spill, Earth Day began after the largest protest ever for new clean air and water laws....
Kinetica Geospatial Visualization for Tableau
Best-in-breed BI tools, like Tableau, have excellent geospatial visualization for small and manageable data sets....