What's New
Go to:It’s been widely reported that the IoT market is expected to generate significant market opportunity – upwards of $267 billion — by 2020. Numbers aside, one of the main drivers is the rapid growth of IoT and connected devices consumed at both the consumer and industrial level, leading to an extreme side effect — a massive explosion…
Indonesian digital payments platform launches vending machines that engage with you Vending machines are ubiquitous in Asia, selling everything from umbrellas to shirts and ties, hot drinks to whole coconuts. And the pace is picking up in Indonesia, a country with previously slower market penetration. Communities in Jakarta and other major cities are warming up…
The Extreme Data Economy is premised on shared signal data and networked infrastructure and demands not just analysis, but immediate action: a process called active analytics.
In previous articles we have shown you how you can use Kinetica to collect geospatial streaming data from Meetup.com and visualize it using either Kinetica Reveal or a custom application connecting to the database using Javascript API. These days, visualizing and basic statistical analysis is often not enough to give your company a competitive advantage.…
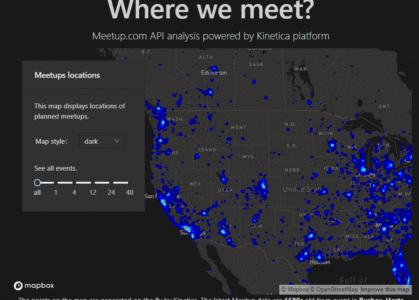
In the previous post, we showed you how to import our Meetup.com data into the Kinetica database, and use Reveal to analyze and visualize this data. What if you want to create your own application to include this data and analysis? In this article, we will show you how you can use Kinetica’s Javascript API and…


